A logo for coastal ocean vision with a blue eye
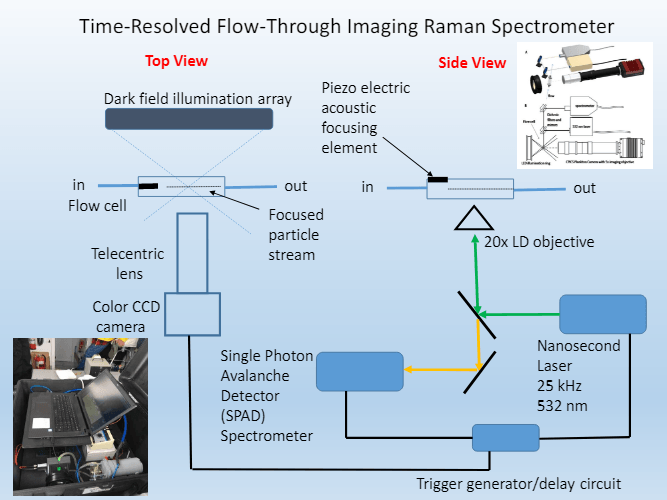
Microplastics – Development of a Raman Flow Through Microplastics Analyzer
CovTeam • June 21, 2021
  • Micro-plastic particle analysis of hudson river surface water using an underway flow-through imaging raman spectroscopy

    Slide title

    Write your caption here
    Button
  • Understanding the fate and effects of microplastics in the ocean is fundamentally an oceanographic problem

    Slide title

    Write your caption here
    Button
  • A diagram of raman spectroscopy to detect classify and quantify plastics in the ocean

    Slide title

    Write your caption here
    Button
  • A graph of fluorescence contamination of the raman signal

    Slide title

    Write your caption here
    Button
  • A diagram of a time resolved flow through imaging raman spectrometer

    Slide title

    Write your caption here
    Button
  • A map showing the location of tall river cruises

    Slide title

    Write your caption here
    Button
  • A few graphs and a picture of a worm under a microscope

    Slide title

    Write your caption here
    Button
  • A graph showing the concentration of polyacrylonitrile pan

    Slide title

    Write your caption here
    Button
  • A set of three graphs showing different types of plastics

    Slide title

    Write your caption here
    Button
  • A set of three graphs showing different types of plastics.

    Slide title

    Write your caption here
    Button
  • Three graphs showing different types of polymers concentrated throughout a river

    Slide title

    Write your caption here
    Button
  • A graph of microcystis aeruginosa also in roman library

    Slide title

    Write your caption here
    Button
  • A table showing what 's in the river

    Slide title

    Write your caption here
    Button
  • A graph showing the effect of density on location

    Slide title

    Write your caption here
    Button
  • A graph showing the temperature and salinity of water

    Slide title

    Write your caption here
    Button
  • A diagram of two layer estuarine flow and concentration of mps on density front

    Slide title

    Write your caption here
    Button
  • A graph of the hudson river salinity front in spring and summer

    Slide title

    Write your caption here
    Button
  • A graph showing the amount of dense microplastics in all parts of the water column

    Slide title

    Write your caption here
    Button
  • Conclusions based on density mps were concentrated at density fronts near and below the tappan zee bridge

    Slide title

    Write your caption here
    Button
A bunch of sponges are growing on a coral reef.
February 15, 2023
CoastalOceanVision exhibited at the AGU meeting the week of December 12 and showed live demonstrations of swimming Artemia larvae and juveniles. COV members Cameron Fairclough, Jared Schwartz and CEO Fred Richards held back the 8000 strong crowd and provided AGU members with product information on our plankton imaging system called CPICS and the Ocean Observing System called OceanCubes.
A sun shaped object is glowing in the dark
By CovTeam June 21, 2021
https://coastaloceanvision.com/wp-content/uploads/2021/06/Demo-Classification-RealTime-2.mp4 The post Real-Time Classification of CPICS Images appeared first on Coastal Ocean Vision.
Share by: